In the age of data-driven decision-making, businesses must understand how to handle and evaluate data effectively. Nearly three-quarters (70%) of businesses report that they struggle to extract relevant insights from their data. Enter Microsoft Power BI, a simple business intelligence solution that lets you visualize and share data insights. However, to fully leverage Power BI’s capabilities, mastering the art of data modeling is essential.
Table of Contents
Data modeling is the foundation for all Power BI analytics. It specifies how data is organized and how various types of information relate to one another. This piece will go over the principles of data modeling in Power BI, including its importance and how to develop effective data models. We will discuss best practices, common issues and advanced capabilities that can improve your Power BI experience. You will start building data models and produce meaningful insights in a jiffy.
Data Modeling Overview
Data modeling is the process of creating a conceptual representation of data structures, relationships and constraints. In simple words, it is about organizing your data so that it is easy to understand. A well-structured data model simplifies data retrieval and provides consistency in data interpretation across several reports and dashboards.
Check out what a data model is in detail to get a deeper understanding of the concept.
Types of Data Models
- Conceptual Data Model: This high-level model provides an overview of what the data is about and how different entities relate to each other without getting into technical details.
- Logical Data Model: This model is more detailed, defining the structure of the data elements and their relationships while remaining independent of any physical database management system (DBMS).
- Physical Data Model: The model describes how data will be stored in a database including tables, columns, data types, constraints and indexes.
Effective data modeling improves the efficiency of querying, analysis and reporting. Airbnb, for example, uses data modeling to study user activity and preferences, allowing them to enhance their marketing techniques. They can generate insights that lead to better user experiences and more bookings.
Power BI Overview
Microsoft Power BI is a very powerful business analytics tool that transforms raw data into dashboards and actionable insights. It enables users to generate visualizations and communicate insights in real-time. Power BI combines ease of use with powerful analytical capabilities which makes it suitable for both technical and non-technical users.
Features of Power BI
Power BI has many core features which includes:
- Data Connections and Transformations: Power BI supports a wide range of data sources, including databases, web services, and flat files. Power Query allows users to clean and transform data before analysis. This feature is critical to maintaining data quality and consistency.
- Rich Visualizations: Power BI gives you many options such as charts, graphs, maps, ArcGIS integration and many more.
- Collaboration and Sharing: Users can publish their reports to the Power BI service, making it easy to share insights with team members and stakeholders.
You will find many companies that use Power BI. Companies such as Walmart leverage Power BI to track KPIs and sales trends, enabling them to make data-driven choices that increase revenue and customer satisfaction.
Importance of Data Modeling in Power BI
When it comes to Power BI, data modeling is extremely significant for a number of reasons:
- Improved Data Integrity: A well-structured data model reduces the chances of mistakes and inconsistency. Users will be more comfortable in the accuracy of their reports by creating table and relationships with suitable data types.
- Improved Model Performance: The data model becomes optimized which reduces the time it takes to query data. This makes it easy to deal with massive data sets. A simple data model allows users to explore data relationships quickly. It provides a logical framework that is capable of handling complex queries and calculations.
- Collaboration and Scalability: A strong data model is the basis for scaling data operations as teams and data sources grow. It makes it easy for new team members to understand how the data is organized, which encourages them to work together.
- Customizable Reports: Users with a strong data model can produce customized reports specific to their business. You can meet requirements with different stakeholders in this customization.
For example, Nestlé is the world’s largest manufacturer of food and beverage products. Finding and managing the right resources for employees to make smart business decisions is crucial and tough in an organization of this size. Nestlé started using Microsoft Power BI in 2018. It enabled stakeholders to access real-time data without having to wait for reports.
Also, take a look at how you can create a data model to get a better understanding of the same.
How to Build a Data Model in Power BI
The process of constructing a data model requires a number of steps. You can follow these steps:
Step 1: Import Data from Source

To get started, import data from a variety of different sources. The Power BI platform allows users to establish connections to cloud services, file formats and databases. Choose the “Get Data” option to select the data source and then import it into Power BI.
Step 2: Clean and Transform Data
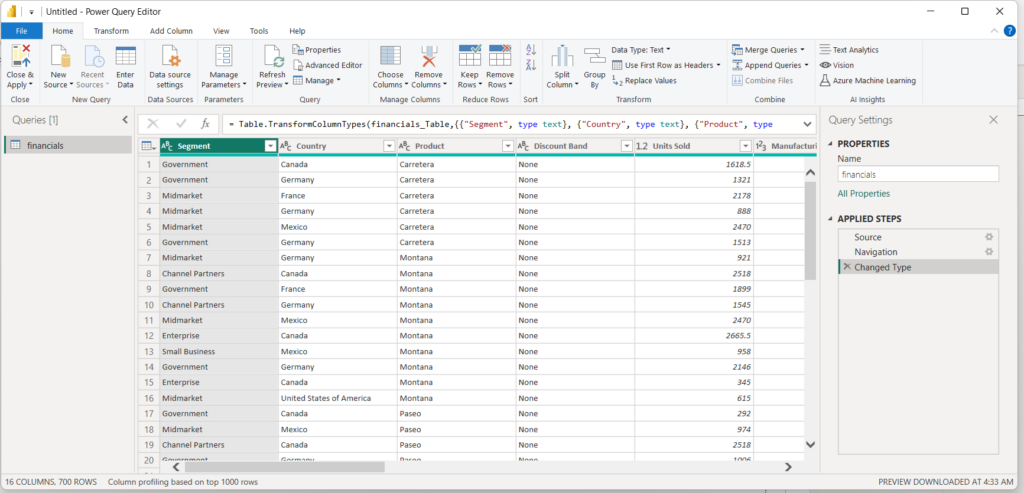
With the help of Power Query, you may clean and transform the data after it has been imported.
This includes:
- Removing Duplicates: Ensure there are no duplicate entries in your dataset.
- Filtering Rows: Exclude irrelevant data that won’t be needed for analysis.
- Changing Data Types: Ensure each column has the correct data type (e.g., text, number, date).
- Creating Calculated Columns: If needed, create new columns based on existing data to facilitate analysis.
Step 3: Specify Tables and Columns
You have to define the tables and columns that are required. For instance, each table should be linked to an entity such as the customers or transactions tables.
Step 4: Create Relationships
Establish relationships between tables to enable Power BI to join data meaningfully. This step involves:
- Identifying Key Columns: Figure out which columns, like customer ID and product ID, will be used as keys to connect tables.
- Define Relationship Types: Select the appropriate relationship type (one-to-many, many-to-many) based on how the data is related.
- Setting Up Cross-Filtering: Enable cross-filtering so that filters can flow between tables that are linked, which makes analysis more useful.
Step 5: Define Measures and Calculations
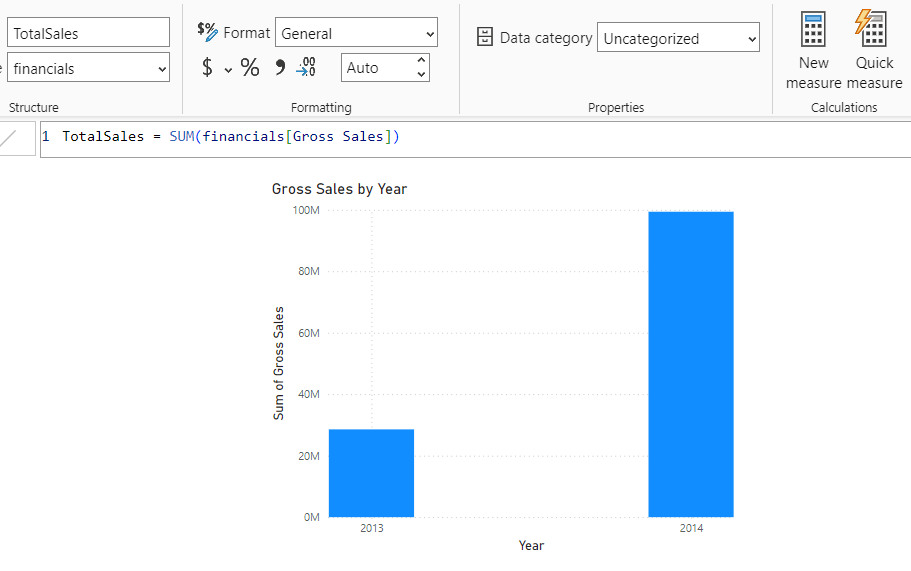
Use DAX (Data Analysis Expressions) to create calculated columns and measures that provide more context. You could make a measure to figure out the total number of sales.
Step 6: Verify Data Integrity
You should regularly check your data to ensure that it is accurate and that relationships are working properly. A quick review helps catch errors before they impact reports.
How to Create Relationships in Power BI

- Open Model View: Go to the Model View. It is easier to handle your data model when tables and relationships are shown visually.
- Connect Fields: To make a connection, you should drag a field from one table and drop it on the field in another table that matches it.
- Select Relationship Type: The way your tables are organized will help you choose the right relationship. Power BI will suggest a relationship if two columns are the same.
- Adjust Cross-Filtering Options: If you need to, turn on bidirectional filters. This feature allows you to filter multiple tables, which makes analysis more flexible depending on the use case.
- Validate Relationships: After creating relationships, validate them by checking if they reflect the intended connections. You can visualize how data flows through your model, ensuring accuracy and clarity.
You let Power BI do accurate calculations and groupings, which results in more useful reports.
Best Practices for Power BI Data Modeling
- Descriptive Names: You should choose descriptive names for tables, columns, calculated columns and measures. Unclear names make it harder for people to understand the data model.
- Limit Calculated Columns: Try to create calculated measures rather than columns when possible. Calculated measures are more efficient and take less space in memory. Performance remains optimized.
- Group Related Tables: Organize your tables into schemas or logical groups. This enhances readability and helps users understand the relationships between different data entities.
- Optimize for Performance: Remove any unused columns and rows to keep the data model lean and responsive. Reducing the amount of data being processed improves performance and speeds up the execution of queries.
- Test, Update and Document: It is important to check the model to make sure that it meets all of the business criteria. Maintain documentation that describes each data source, relationship and calculation in detail. This serves as a reference for others who work with the model.
Common Challenges in Data Modeling
Data modeling can be challenging. Here are some common problems you might have and how to fix them:
- Problems with Data Quality: Inconsistent or inaccurate data can lead to bad insights. You should invest time in data cleaning and validation to ensure high-quality data is used for modeling.
- Complex Relationships between Entities: There may be a lot of complicated relations between tables that make things hard to understand. Relationships should be simplified. You should also avoid building many-to-many relationships as these can complicate measure calculations.
- Performance Bottlenecks: Large datasets might reduce performance. You should optimize your model by limiting data volume. You should use appropriate data types and create data aggregations.
- Lack of Documentation: Inadequate documentation can lead to misunderstandings. Keep detailed records of your data model to support future users and ensure consistency.
- Change Management: As the needs of the business change, data models may need to be changed too. You should plan a change management process to handle updates and make sure that everyone who needs to know is aware of them.
Advanced Features in Data Modeling
Power BI has a number of advanced tools that can make data modeling easier for you, such as:
- Dataflows: Dataflows allow you to build reusable data transformation processes. You can make data preparation more consistent and speed up multiple reports.
- Incremental Refresh: When you use the incremental refresh, you can optimize the loading of data by only updating data that has changed since the last refresh. This tool works really well for big datasets.
- Composite Models: Power BI allows the creation of composite models, which enable users to combine data from different sources, including direct query and imported data. This flexibility makes data modeling more useful.
- Row-Level Security (RLS): RLS allows you to restrict data access for specific users based on their roles. This feature is vital for maintaining data privacy and security.
- What-If Parameters: These parameters allow users to conduct scenario analysis by dynamically changing values in calculations. Businesses can look at possible outcomes based on different assumptions using this tool.
Conclusion
Data modeling in Power BI is a fundamental skill for anyone looking to leverage data for better business decision-making. Users can make efficient data models that make intelligent analysis easier. You can improve your modeling skills by following best practices, addressing common challenges and exploring advanced features.
In a world where data is the new currency, organizations that invest in effective data modeling will be better positioned to make informed decisions, adapt to changes, and drive growth. It does not matter whether you’re an experienced data analyst or a newbie; implementing effective strategies in Power BI is the key to achieve full potential of your data.
Remember that data modeling is an iterative process. Always make your models better, keep them up to date with new features and be willing to learn from problems. Well-structured data models can give businesses new ideas that can help them do better and make their strategies more effective.
Sign up for a 14-day free trial and simplify your data integration process. Check out the pricing details to understand which plan fulfills all your business needs.
Frequently Asked Questions
1. What is the difference between data modeling and data visualization?
Data modeling defines the data structure, relationships and rules. Data visualization uses visuals such as charts and graphs to represent data which can be easy to understand.
2. What do you mean by data modeling?
Data modeling is the process of organizing data in a logical manner that defines how different data elements interact.
3. Which schema is best for Power BI?
Star schema is usually the best choice in Power BI. Leverage star schema if possible because it has benefits. In a star schema, a central fact table is surrounded by dimension tables, improving query performance and simplifying relationships.

