In today’s data-driven world, everybody tends to make decisions on facts. Facts in turn can only be derived through high quality and accurate data. But how do we calculate the quality and accuracy of data? Data teams often find it difficult to measure quality and identify issues with their data. This is where Data Quality Metrics come into play.
Table of Contents
Data Quality Metrics provide the framework for organizations to assess the quality and maintain integrity of their data. This helps data teams evaluate important aspects of data, such as completeness, accuracy, availability, reliability, and many more.
This blog post explores key metrics and KPIs for assessing data quality and ensuring reliable data, to support better decision-making.
Understanding Data Quality
Before we move on to understanding various Data Quality KPIs, let’s first define Data Quality and explain why it is important.
What is Data Quality
Different data users may have different definitions of data quality according to their use case. Data Quality is the state of data. It is the degree to which it fits the intended use, helps in decision-making, and fulfills the purpose.
Various factors and characteristics contribute to data quality, including, but not limited to, Accuracy, Completeness, Integrity, Consistency, Timeliness, and Uniqueness. For a good strategy, it is important to have a way to measure these quality characteristics.
Why Data Quality Matters
Data Quality is important because it directly affects decision-making, operational efficiency, and customer satisfaction. High-quality data helps organizations make informed decisions. Poor data quality, on the other hand, can lead to misguided strategies, inefficiencies, customer dissatisfaction, and legal risks.
Key Data Quality Metrics and KPIs
By defining Data Quality Metrics, data teams can monitor data health and present facts about data. The following are some metrics used to measure data quality.
Total Number of Incidents
It is the total number of data incidents or issues that occurred in a given period. These could include data outages, inaccuracies, or failures in data processing pipelines.
Data Downtime
Data Downtime is the period for which data is unavailable, inaccurate, or compromised. This may occur due to failure in data pipelines, data load, incorrect data entries, or system failures. It is calculated by the number of times data was compromised divided by the total time to detect and resolve the issue.
Table Uptime
It is defined as the total time the database was highly available and functioning correctly. It is important to ensure data reliability and availability to access data.
Time to Response
It is the time data teams take to respond to a data incident. Agile teams tend to respond faster. This measure helps data teams reflect on the development strategy.
Time to Fix
It is the time data teams take to identify and resolve the incident. These metrics help calculate the efficiency of data teams in resolving issues.
Importance Score
This metric identifies and defines rank to various tables, databases, and data platform tools based on their significance and usage. This helps data teams decide what is important for business processes and optimize cost.
Table Health
This metric is calculated to determine the overall table health. It is derived from a combination of multiple metrics, such as table uptime, data availability, and accuracy. It helps teams identify the actual reason for their data issues.
Table Coverage
It defines how many attributes of data tables are being covered by the data quality framework. High coverage means the table is actively being monitored for most aspects of the issues
Monitors Created
The number of monitoring dashboards and alerts created to track the health or accuracy of data tables.
Number of Un-used tables
The count of inactive tables can help data teams decide on the right storage strategy and declutter the database, which can improve clarity and reduce costs.
Deteriorating queries
Monitoring Queries is as important as monitoring tables. Inefficient queries may slow down the existing system and may interfere with other processes. Monitoring this can help maintain performance. These can be identified by looking at the average runtime of each query.
Status Update rate
The Status Update rate can be defined as the rate at which the status of health, queries, or systems is updated. This can help data teams track the accuracy and timeliness of their monitoring system.
Implementing Data Quality Metrics in Your Organization
We have discussed the importance of Data Quality and some metrics that can be used to measure it. These metrics can only be fruitful if implemented effectively. Addressing data quality issues often starts with defining key metrics that reveal where data may be inaccurate, incomplete, or inconsistent. Here’s how to get started.
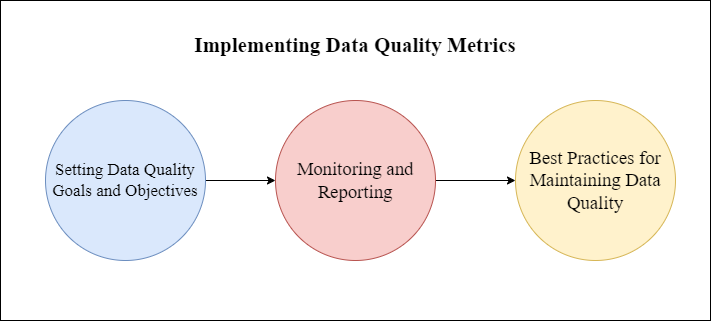
Setting Data Quality Goals and Objectives
- Identify Clear Metrics: Identify data quality metrics that matter the most to your team, such as accuracy, completeness, timeliness, etc.
- Align with Business Goal: Check if the identified metrics meet your organization’s broader business objectives. For example, if customer satisfaction is important to your organization, have metrics around it.
- Set Measurable Targets: Defining measurable metrics is as important as identifying them. For example, aiming for 100% deduplication or 97% uptime.
Monitoring and Reporting
- Establish Regular Monitoring: Implement automation for monitoring metrics defined above. For example, Build real-time dashboards and alerts for anomalies.
- Create Comprehensive Reports: Develop reports that summarise performance around defined metrics. These reports should clearly indicate concerns and progress.
- Involve Stakeholders: Share these reports with Data Stakeholders so that everyone stays aware of issues and needed data quality improvement efforts.
Best Practices for Maintaining Data Quality
- Data Governance Framework: Document and Implement a framework that includes policies, roles, and responsibilities for maintaining data quality. An effective agile data governance approach can support robust data quality initiatives by fostering a flexible yet structured environment for maintaining data standards.
- Regular Data Audits: Conduct regular audits to identify and address quality issues, such as duplicate records, missing data, or outdated information.
- Training and Awareness: Educate team members on the importance of data quality and provide training on best practices for management and monitoring.
- Continuous Improvement: Achieving data quality is an ongoing process. The framework must be reviewed regularly to accommodate changing business needs.
Problems with Data Quality Monitoring
While data monitoring is a crucial part of any data strategy, data teams might face issues in implementing the process :
Inconsistent Data Sources
Businesses often pull data from various sources that may have different formats, structures, and standards. Thus, applying unified data quality metrics becomes challenging and may lead to erroneous reports.
Resource Constraints
Incorporating data quality monitoring solutions can be expensive, requiring tools, technology, and training investments. A limited budget can limit the data engineering team’s ability to implement effective monitoring systems.
Subjective Quality Standards
Data teams may find it difficult to quantify subjective quality standards. Different stakeholders might have different definitions of metrics. Moreover, changing business requirements can hinder the data team’s ability to establish a standard framework.
False Positives and Negatives
Oversensitive monitoring systems may generate a lot of alerts, which might result in important alerts being overlooked. Conversely, monitoring systems may also miss alerts.
Integration with Existing Systems
Integrating new data quality monitoring tools with existing data systems can be complex and may lead to technical difficulties. With increased data volumes, existing monitoring tools may be difficult to scale.
How Hevo helps assure data quality.
Hevo is a no-code, self-service ETL platform with built-in features to ensure data quality standards. Here is how Hevo helps manage and monitor data quality :
- Automated Data Quality Checks: Hevo enables prebuilt or customized checks to fit your special data quality requirements. This ensures that your system meets the desired standards.
- Error Monitoring and Alerting: Hevo’s advanced monitoring tools help you track data flow and quality continuously and alert you of anomalies or errors. These monitoring features can help you identify and address data issues before they impact business decisions.
- Data Cleaning: Hevo allows you to clean data automatically on the fly. This ensures your data is accurate, consistent, and ready for analysis.
- Scalability: Hevo’s platform is designed to scale with your data needs without compromising quality.
Hevo helps you maintain high data quality standards to make data-driven decisions based on reliable and accurate information.
Sign up for a 14-day free trial today.
Conclusion
Data quality is very important for data-driven decision-making. By implementing a standardised data governance framework, teams can measure and improve the quality of their data. This approach can empower them to present and make the right decisions based on quantifiable measures. Hevo can help organizations maintain high data accuracy, consistency, and reliability standards. With the right strategies and tools, businesses can confidently rely on Hevo to drive growth, efficiency, and innovation.
FAQs
1. Is data quality a KPI?
No, Data Quality is not a KPI. Data Quality is a state of data which depicts if data meets business requirements. Data Quality Metrics are KPI’s that are used to define quality of data.
2. What are QA metrics?
Quality Assurace (QA) metrics are measures that evaluate Quality of processes, data or functionality. In terms of data, QA metrics might include measures like error rates, total uptime, time to response etc.
3. What are the 7 C’s of data quality?
The 7 C’s of data quality are a set of principles of data quality. They typically include:
Consistency: Data is uniform across sources.
Completeness: All required data is present.
Conformity: Data meets required standards and formats.
Currency: Data is up-to-date.
Accuracy: Data has correct values.
Credibility: Data is reliable.
Compliance: Data complies with standard guidelines.
4. What are the 12 dimensions of data quality?
The 12 dimensions of data quality are the dimensions across which data quality is assessed. These dimensions are Accuracy, Completeness, Consistency, Timeliness, Validity, Uniqueness, Integrity, Conformity, Relevance, Reliability, Precision, and Traceability. They can help assess data holistically.
Share it with your connections.
-
 Share To LinkedIn
-
 Share To Facebook
-
 Share To X
-
 Copy Link